

Key Takeaways
Stopping Distance
Stopping distance is the total distance a vehicle travels from the moment a driver perceives a hazard to the moment the vehicle comes to a complete stop. It has two parts: the distance covered while the driver reacts (reaction distance) and the distance the vehicle continues to travel while the brakes are applied (braking distance). Together, these two figures determine how much road you actually need to stop safely.
Braking distance increases with the square of speed — meaning doubling your speed quadruples the braking distance required, all else being equal.
Two Numbers Behind Every Stop
Every time you press the brake pedal, two separate distances are adding up — and most drivers only think about one of them.
Reaction distance is the ground your vehicle covers from the moment you see a hazard to the instant your foot reaches the brake pedal. At a typical reaction time of 1.5 seconds, you travel 66 feet at 30 mph, 88 feet at 40 mph, and 132 feet at 60 mph — before braking even begins.
Braking distance is then what the vehicle needs to actually stop once the brakes engage. This figure is where physics starts working against you: because braking distance increases with the square of speed, doubling your speed doesn't double your stopping distance — it quadruples it.
Understanding both components is essential. Stopping distance isn't simply a number to memorize for a driving test; it's a real physical constraint that shapes every safety decision you make on the road.
4×
Braking distance increase when speed doubles
Because braking distance scales with the square of speed, doubling from 30 to 60 mph quadruples the distance needed to stop once brakes are applied.
132 ft
Reaction distance alone at 60 mph
At a typical 1.5-second reaction time, a vehicle traveling 60 mph covers 132 feet before the driver's foot even reaches the brake pedal.
50%+
Increase in braking distance on wet roads
Transport safety research indicates wet pavement can extend braking distance by more than 50% compared to dry conditions, depending on tire condition and speed.
What the Numbers Look Like at Common Speeds
The difference between speeds that feel similar can translate to dramatically different stopping requirements. Here are approximate total stopping distances under ideal dry-road conditions for a typical passenger vehicle, using a 1.5-second reaction time:
- 25 mph: roughly 85 feet total
- 35 mph: roughly 136 feet total
- 45 mph: roughly 200 feet total
- 55 mph: roughly 265 feet total
- 70 mph: roughly 380 feet total
Notice that moving from 55 mph to 70 mph — an increase of only 15 mph — adds roughly 115 additional feet. That's more than half the length of an American football field.
These numbers assume dry pavement, properly inflated tires in good condition, and a driver who is fully alert. Any deviation from those conditions extends the figures. Many drivers routinely underestimate safe following distances, and these numbers help explain why the gap is so consequential.
Conditions That Stretch the Numbers Further
The figures above represent something close to a best-case scenario. Real-world driving rarely offers ideal conditions, and several factors push stopping distance substantially higher.
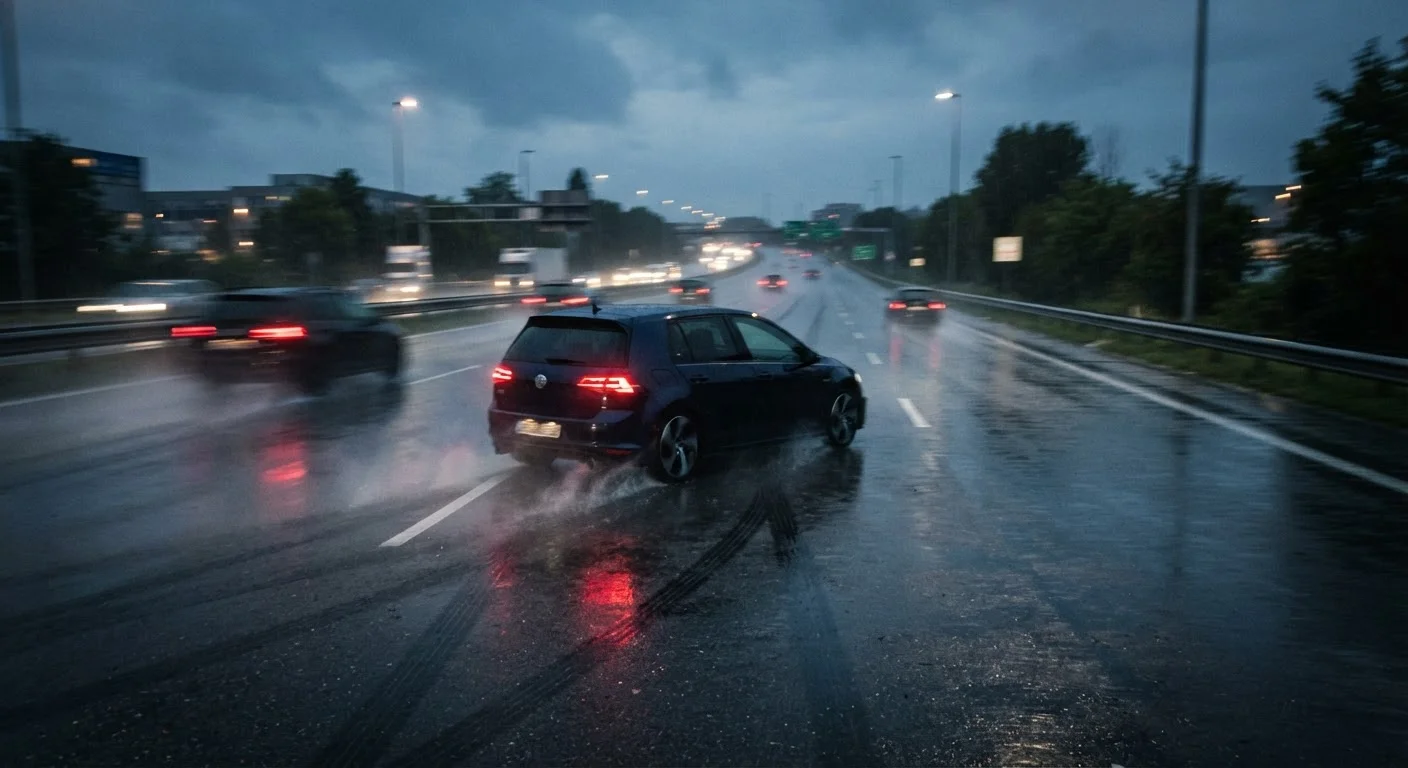
Wet or slippery roads: Water reduces tire friction with the road surface. On wet pavement, braking distance can increase by 50% or more. Ice and packed snow can multiply stopping distances several times over compared to dry asphalt.
Tire and brake condition: Worn tires have less tread to channel water and grip the surface. Similarly, degraded brake components extend the time and distance needed to decelerate. If you notice your vehicle taking longer than usual to stop, pulling to one side when braking, or you hear squealing or grinding, have your brakes inspected promptly. Recognizing early signs of brake wear is one of the most practical steps any driver can take for road safety.
Driver fatigue and distraction: Reaction time is highly sensitive to mental state. A fatigued driver may have a reaction time of 2.5 seconds or more — adding significant extra distance before the brakes engage at any speed. Night driving compounds this further, as reduced visibility means hazards are spotted later, effectively adding to the functional stopping distance.
Use Fixed Objects to Gauge Your Following Distance
Choose a stationary marker — a sign, bridge, or shadow line — and count how many seconds pass after the vehicle ahead passes it before you reach the same point. If it's less than two seconds in good conditions, ease back. In rain or at highway speeds, aim for at least three seconds. This simple habit takes seconds to practice and directly reflects the stopping-distance reality covered in this article.
How to Apply This in Everyday Driving
Translating stopping-distance principles into daily habits is straightforward, though it requires deliberate attention.
Match following distance to speed and conditions. The two-second rule — maintaining at least two seconds of gap behind the vehicle ahead — is a reasonable minimum at moderate speeds in dry conditions. At highway speeds or in rain, extend this to three or four seconds. Urban and rural driving environments demand different approaches to following distance and hazard anticipation.
Adjust speed proactively, not reactively. Posted speed limits reflect conditions on ideal roads in good weather. When roads are wet, visibility is poor, or traffic is unpredictable, reducing speed before a hazard appears — rather than reacting to it — meaningfully reduces required stopping distance. Understanding what different speed limit signs legally mean can also help drivers make better-informed decisions about appropriate travel speed.
Maintain your vehicle. Tires and brakes are the two systems most directly responsible for stopping performance. Regular inspection and timely replacement of worn components keeps your actual stopping distance as close as possible to that ideal-conditions baseline.
Stopping distance is not an abstract concept — it is the physical gap between a near-miss and a collision. Knowing how it scales with speed, and what shortens or extends it, gives every driver a clearer picture of the real safety margins they're working within.